Kubernetes is an open-source system for automatically deploying, scaling, and managing containerized applications. Containerization is a lightweight alternative to full machine virtualization that involves encapsulating an application in a container with its own operating environment. Containerization has matured over the past few years and has led to greater adoption of Kubernetes across the tech industry.
Kubernetes greatly increases a user’s ability to run testing and simulations. At a high level, it allows users to expand their technical resources outside of their traditional limits; for example, users can simulate a 101-node blockchain cluster without needing to own 101 physical machines. This is ideal for quickly standing up staging environments for a blockchain cluster. It is also particularly useful for simulating blockchain networks with proof of stake (PoS) or delegated proof of stake (DPoS) consensus mechanisms, which involve a finite amount (e.g., 101) of geographically distributed block producing/verifying nodes.
Starting with our Testnet Beta “Epik” release, IoTeX has used Kubernetes to deploy and optimize our Testnet infrastructure. Overall, Kubernetes has greatly improved our operations — in this blog, we share our experience and some tips to run your own containerized applications and environments on Kubernetes.
Setting up the IoTeX cluster on Kubernetes
We begin by defining two types of Kubernetes services:
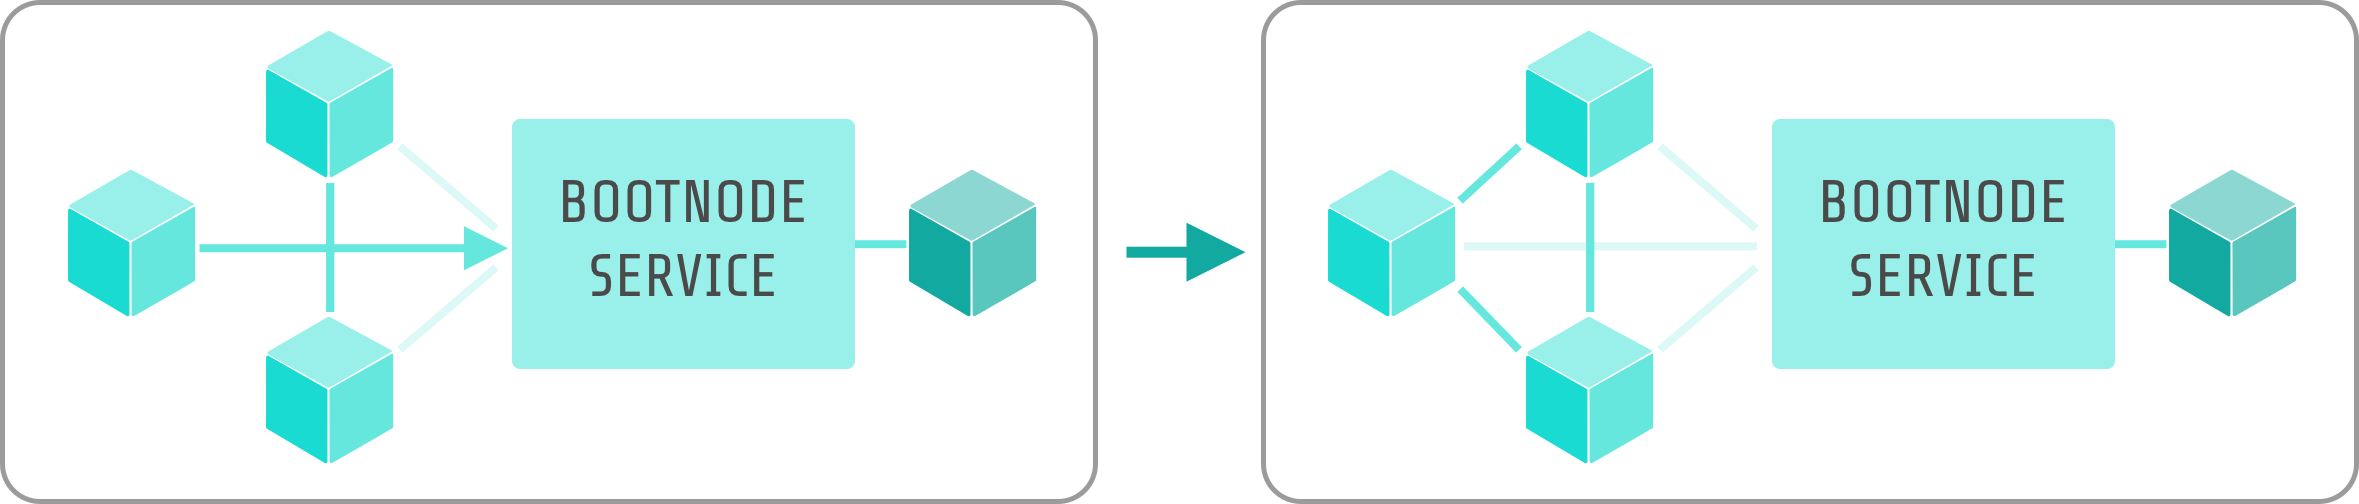
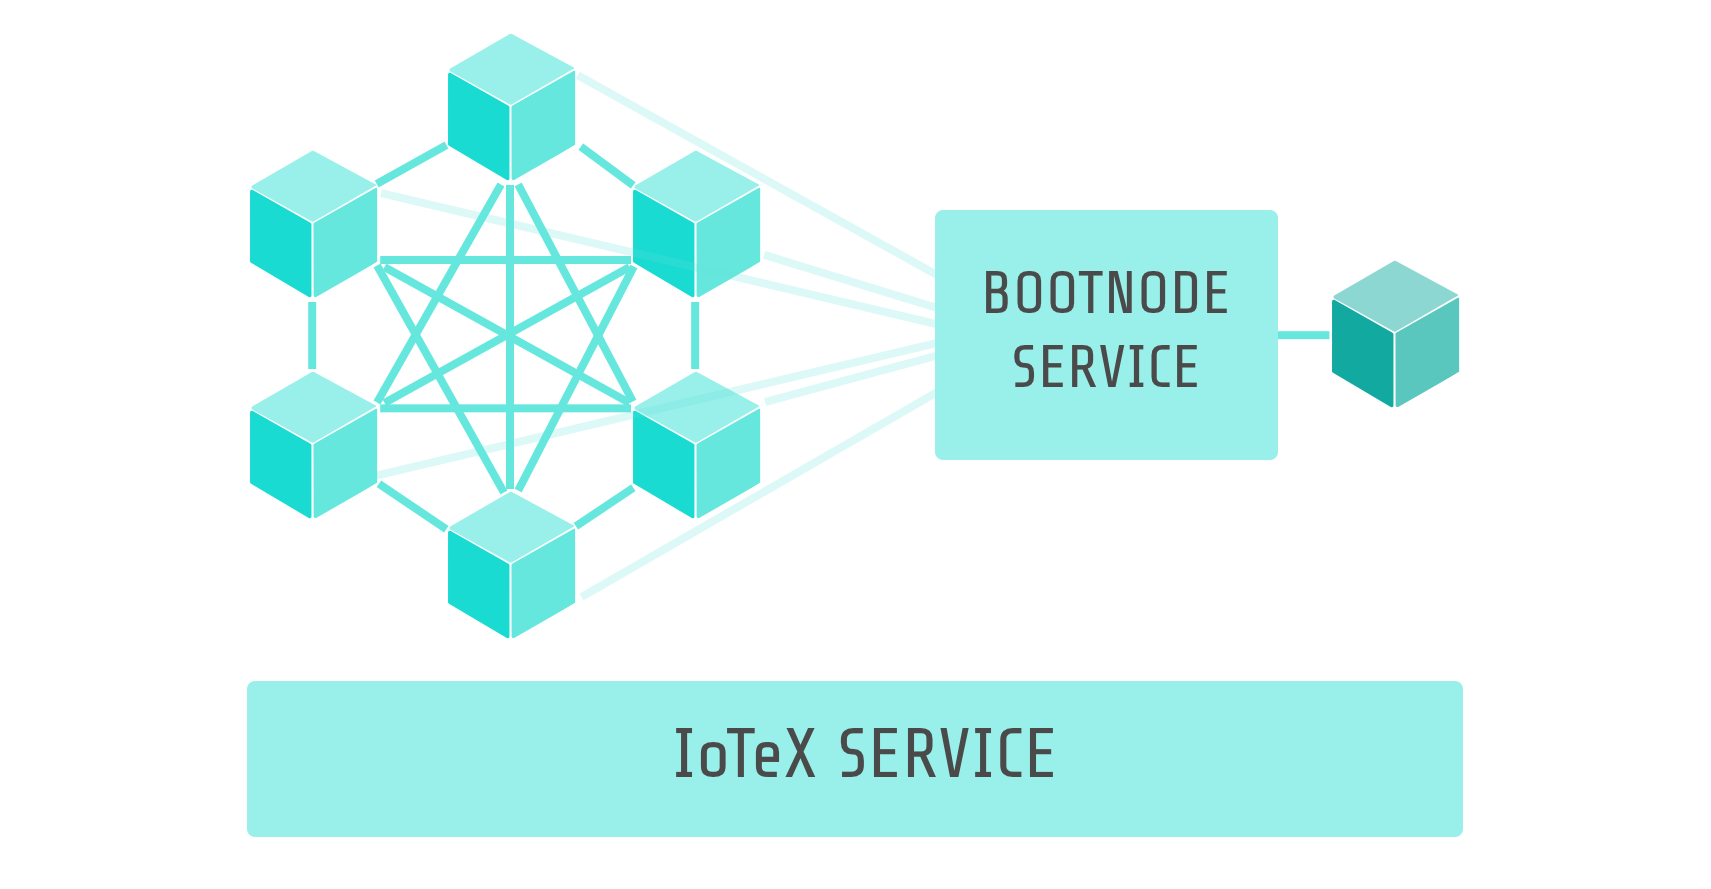
- bootnode service: used to boot up the whole IoTeX cluster. It is the entry point of any new iotex nodes and helps new nodes join the P2P network. All nodes identify each other through their internal Pod’s IP address.
- iotex service: exposes the JSON-RPC API from all iotex nodes. The JSON-RPC interface is used by our open source IoTeX Explorer and our action injection tool.
All node configurations are deployed through the Kubernetes ConfigMap, including the genesis block. This allows us to redeploy a new cluster without waiting for a new docker image to be built.
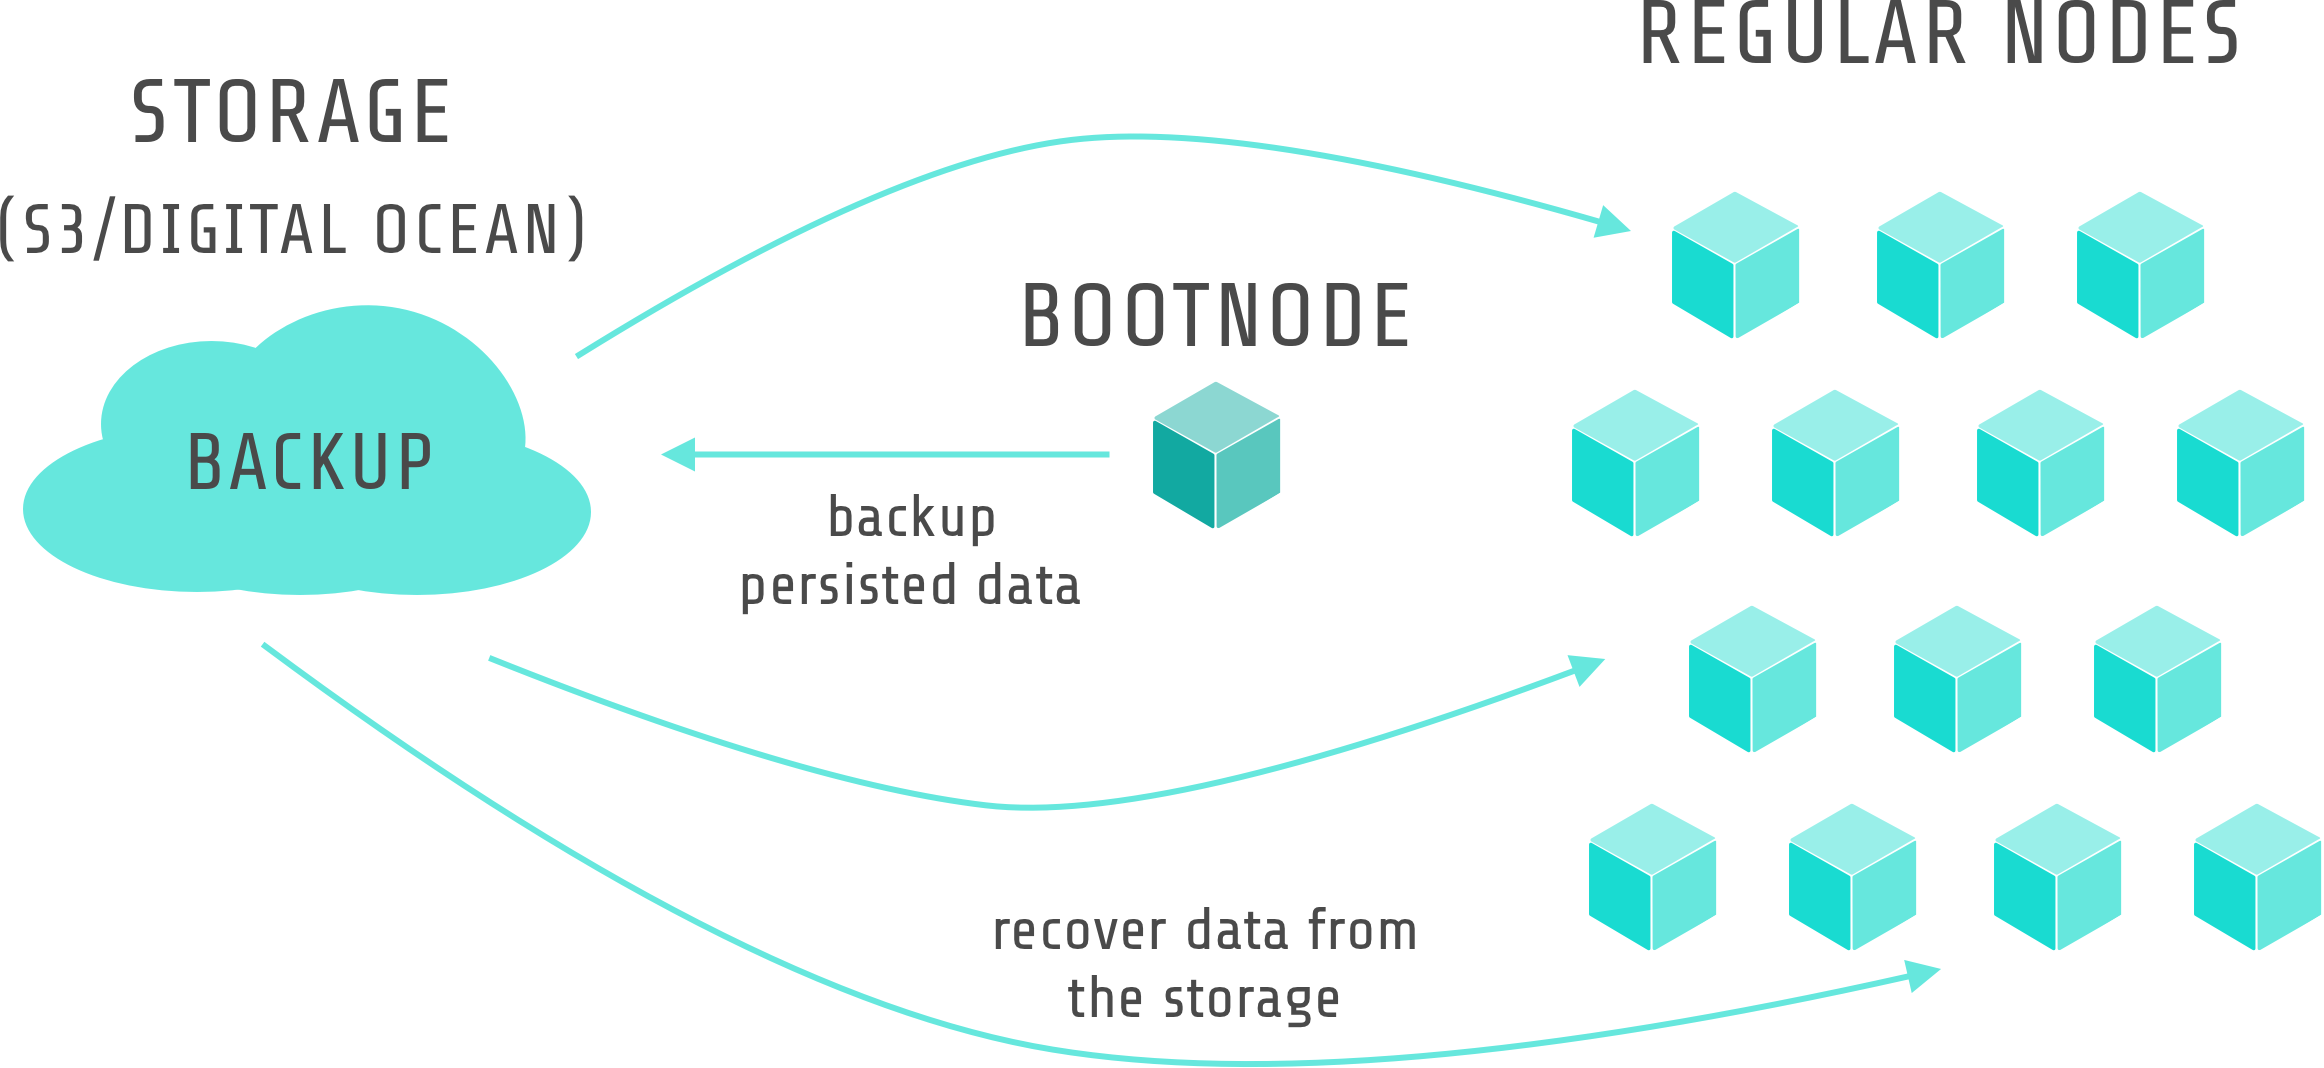
Applications running in Kubernetes Pods are stateless by default, which means saved data from any applications will not be available after a redeployment. To counteract this, we use the following setup process. In our scenario each IoTeX node will utilize the same copy of data (i.e., distributed ledger), so it is not necessary to persist every nodes’ data. Therefore, we mount the Kubernetes Persistent Volume to only one iotex node — in our case, we mounted it to our boot node. We also back up our persisted data to object storage spaces like S3 and Digital Ocean. Since all nodes except the boot node will not have saved data after a redeployment, they will need to first download the backup before startup. We use init containers to achieve this. This process enables our cluster to restart from a crash of our failure without worrying about losing previous data.
Cluster Monitoring
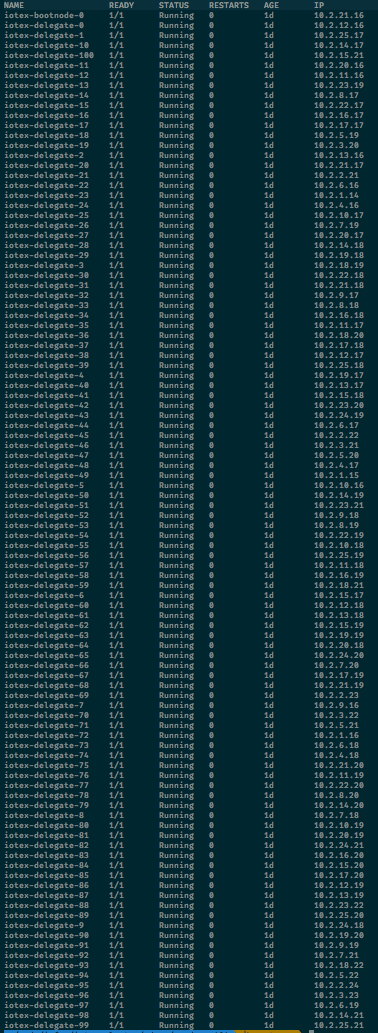
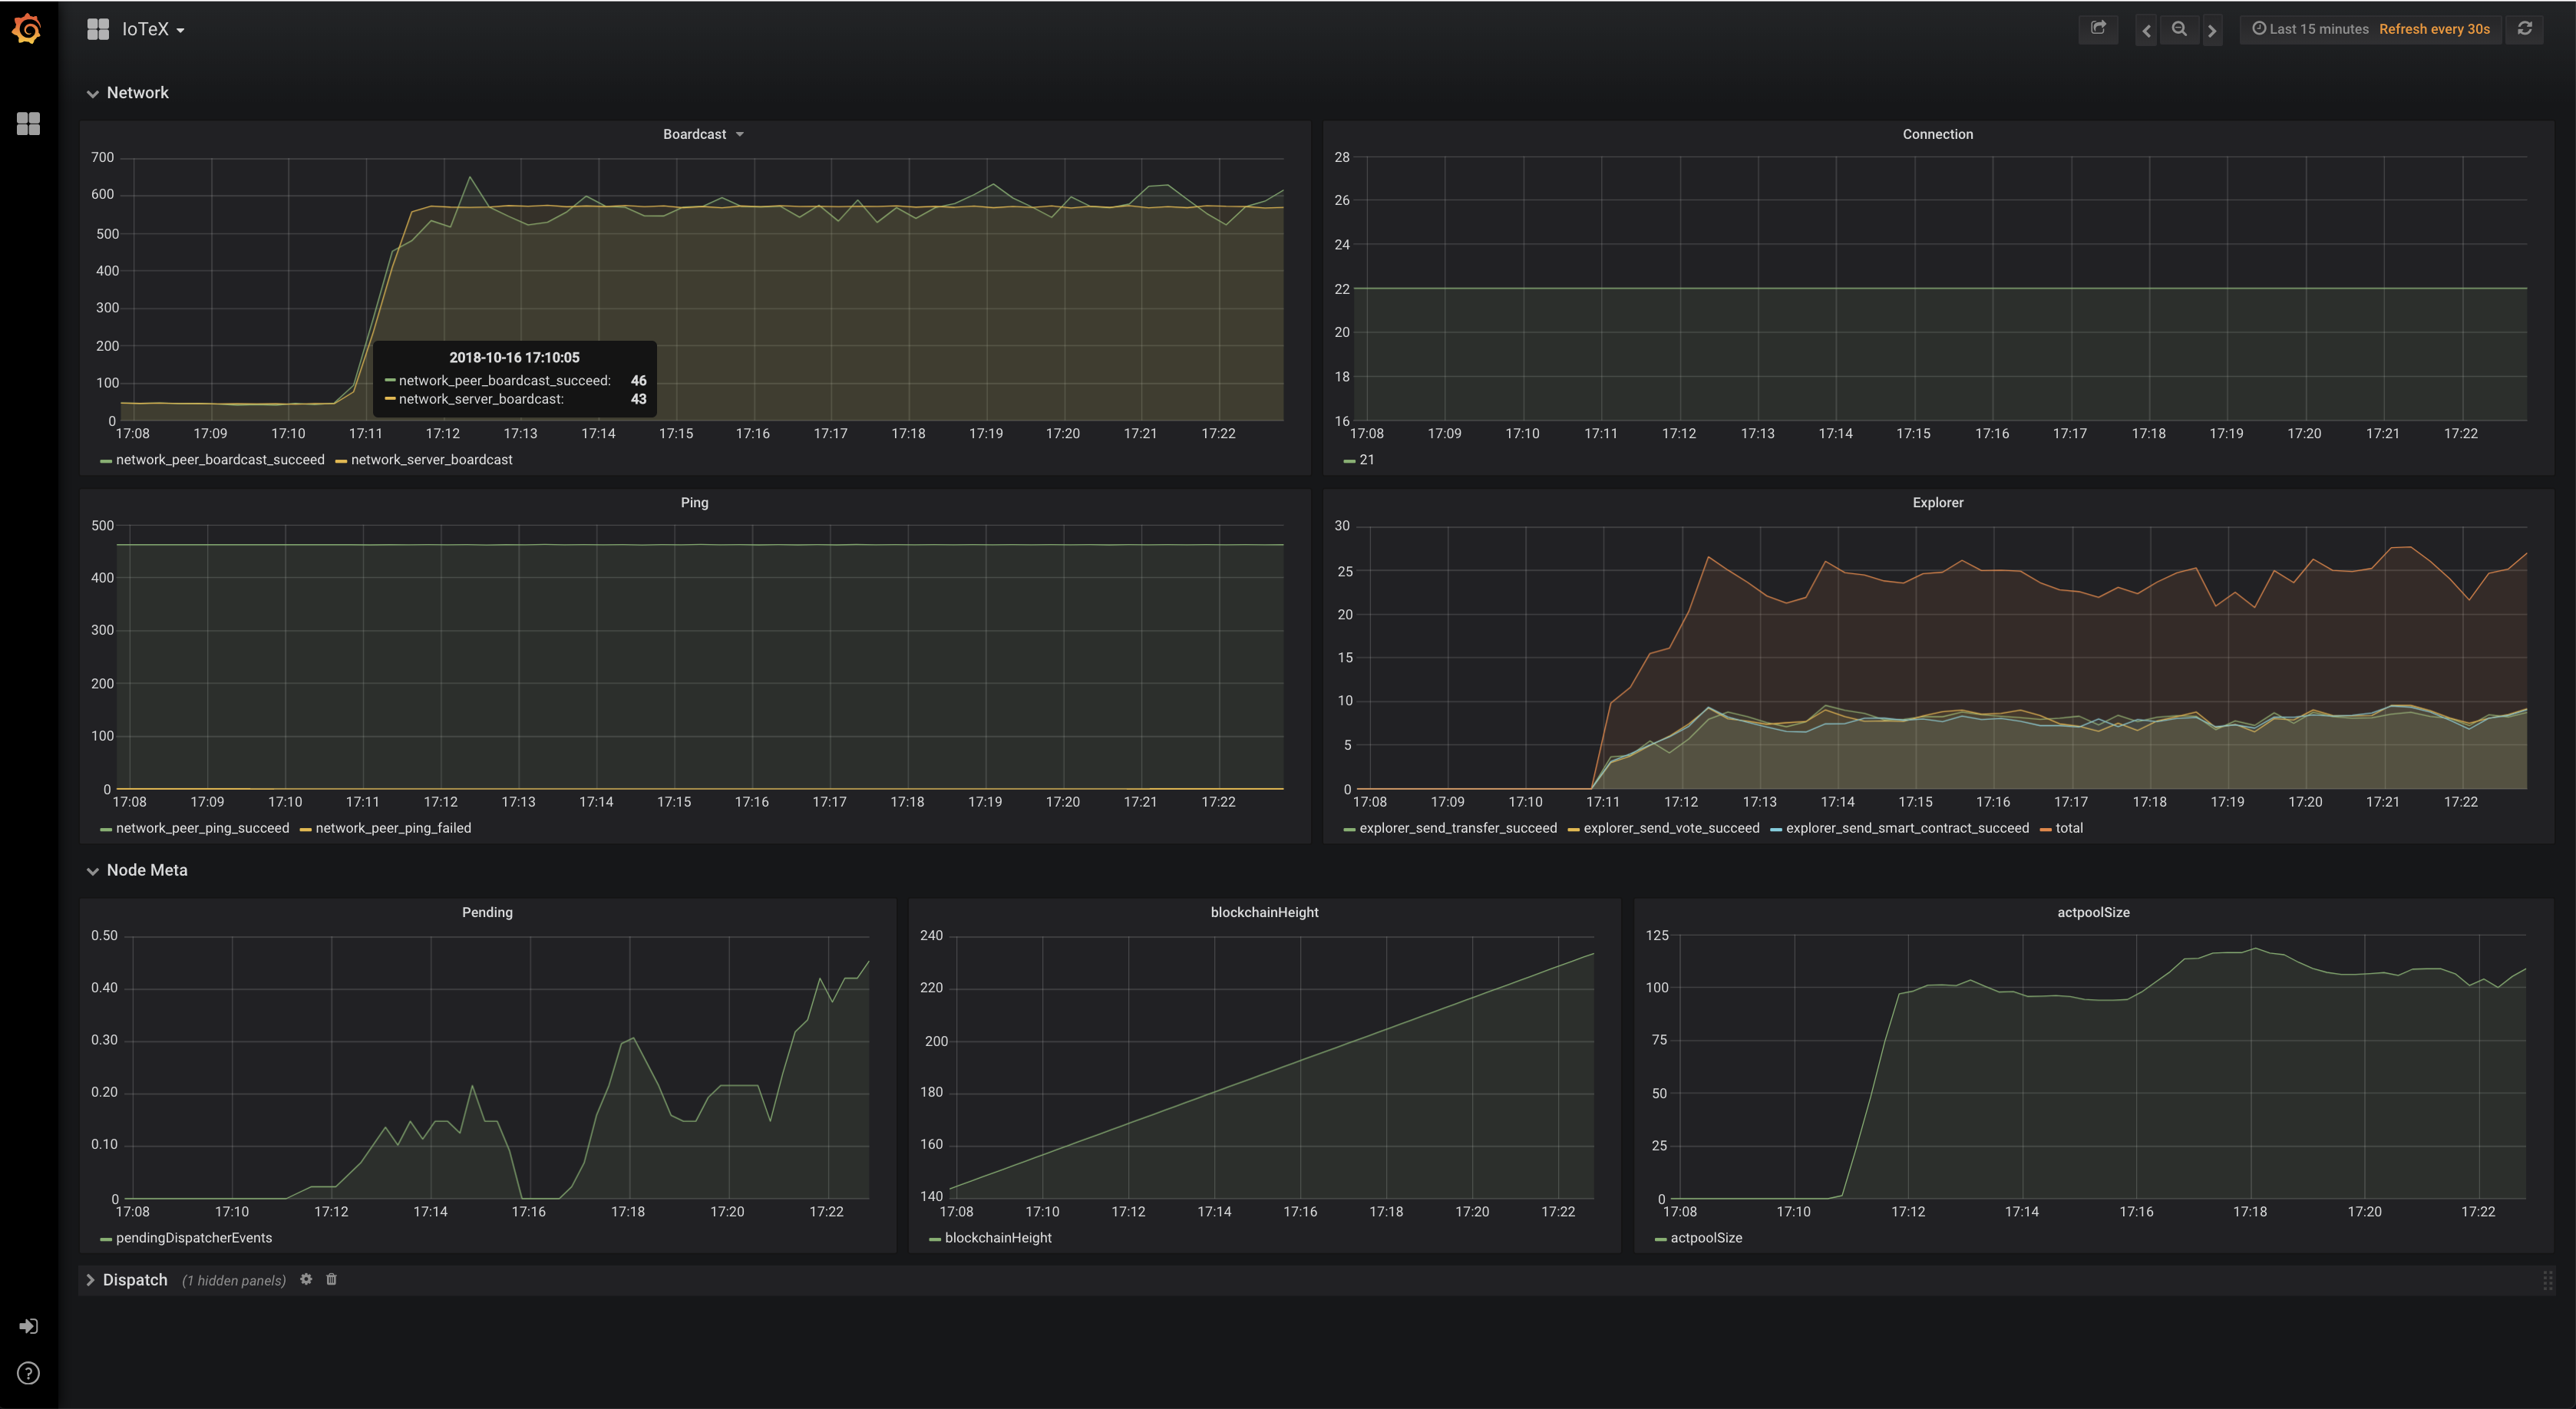
It is not trivial to track the status of 21 nodes (let alone 101 nodes down the road), and it becomes more complex with a larger amount of nodes. To have better observability within our IoTeX cluster, we set up monitoring capabilities in Kubernetes, which consists of a logging stack, metrics stack, and alert manager.
For the logging stack, we use Fluentd + Elastic Search + Kibana + Elastic Search Curator. Fluentd sends logs from each node to the Elastic Search client and the Elastic Search master server indexes the logs which are query-able through Kibana. Finally, we use the Elastic Search Curator to clean up the outdated logs.
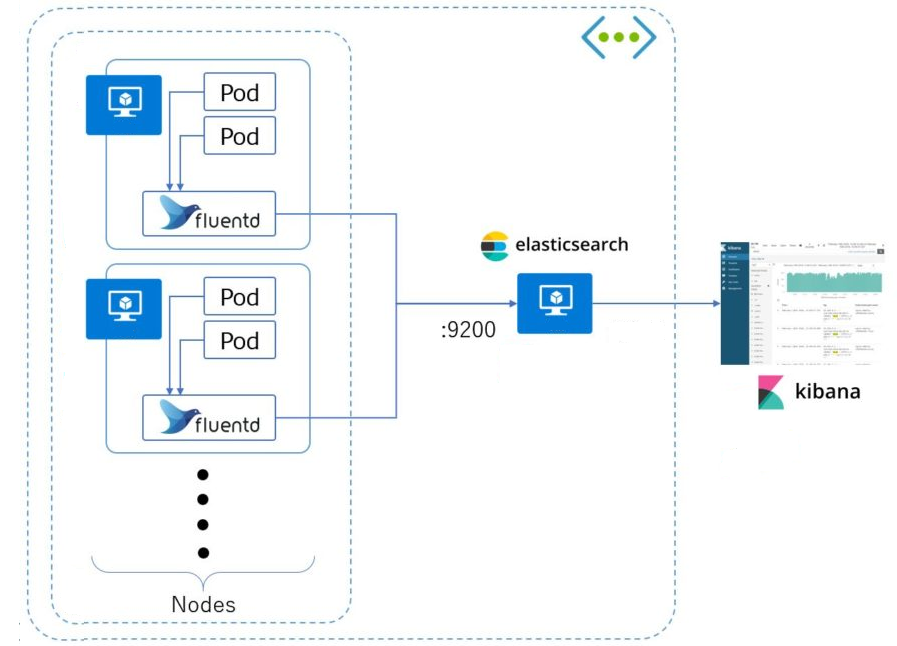
Refer from Log aggregation with ElasticSearch, Fluentd and Kibana stack on ARM64 Kubernetes cluster
For the metrics stack, we use Prometheus + Prometheus Operator + Grafana. CoreOS Prometheus Operator provides an easy way to configure Prometheus running in a Kubernetes cluster. We can hook up the IoTeX node’s Prometheus client with the Prometheus server by simply exposing a metrics service.
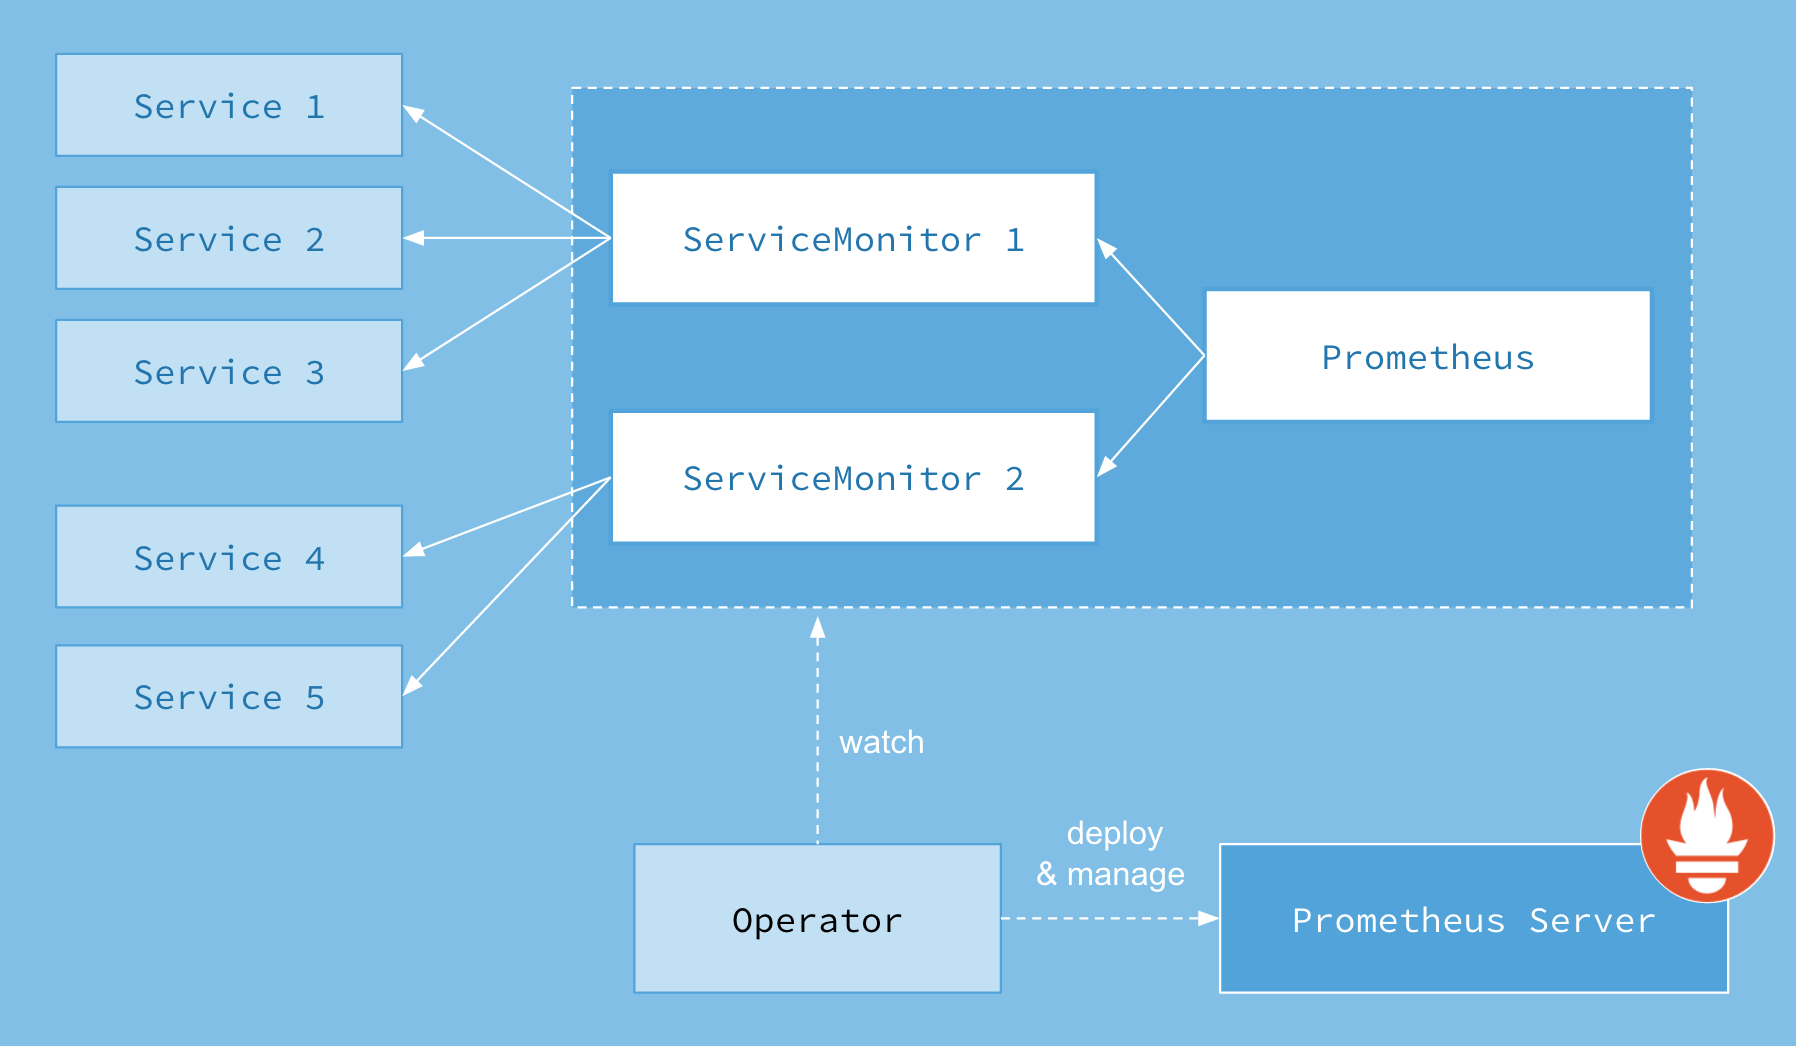
Refer from CoreOS: Prometheus Operator
We are also working on setting up alerts with Prometheus Alert Manager to send out alerts to our on-call engineer when we have abnormal metrics.
Using Helm to Manage Multiple Configurations
Using yaml configuration to deploy different types of applications on Kubernetes is fairly straightforward for a single environment. However, when you have multiple environments (e.g., testing, staging, production) and different node twists/configurations (e.g., 21 vs. 101 delegates), users encounter higher overhead and redundancy to manage various Kubernetes yaml configurations for the same application. To solve this issue, we use Helm.
![]()
Helm is a package manager for Kubernetes applications. It allows us to create our IoTeX cluster as a chart package with version and default values. With Helm, we don’t need to manage duplicate Kubernetes yaml files; rather, we only need to manage a smaller subset of configurations for different environments and twists which overwrite the default value. It also simplifies the command we need to run to start a fresh IoTeX cluster into one single command:
Helm also allows us to publish a chart easily. In the future, we will publish our IoTeX Helm chart to the community, so you can setup an IoTeX cluster within minutes.
More to come!
With the power of Kubernetes and other operational tools, IoTeX’s Development team not only saves time on cluster operation but also digests issues quicker and iterates even faster than before. We look forward to sharing more technical perspectives in the future — feel free to reach out with any questions to [email protected].