Hey IoTraders! (Yeah, that’s a cool name for you guys who trade IOTX tokens).
I would like to share some thoughts regarding the current price and what I expect to see in the short-term. Its clear we’ve been seeing IOTX in its lows and this scenario is supposed to shift soon.
Since some of you maybe aren’t familiar with trading terms I’ll let this discussion as simple/didactic as possible and I really hope you tell me what you think as well. Let’s go:
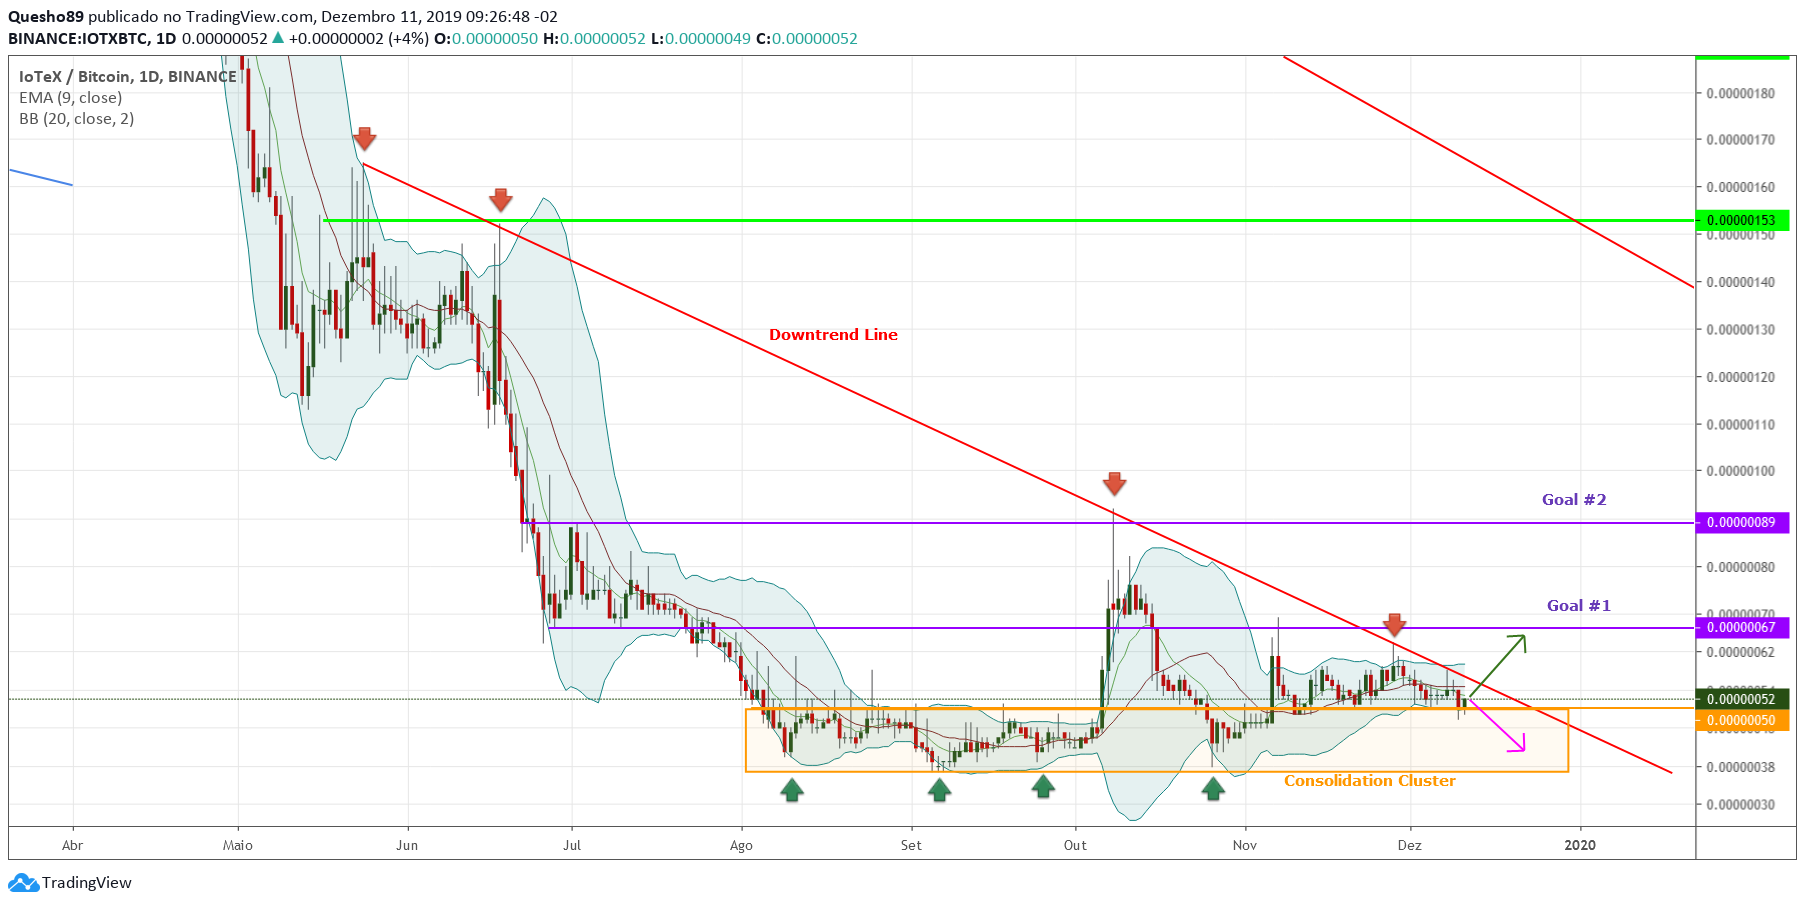
First of all, my feelings for the market are shown in the chart below:
Now, there are some specific points I would like to highlight:
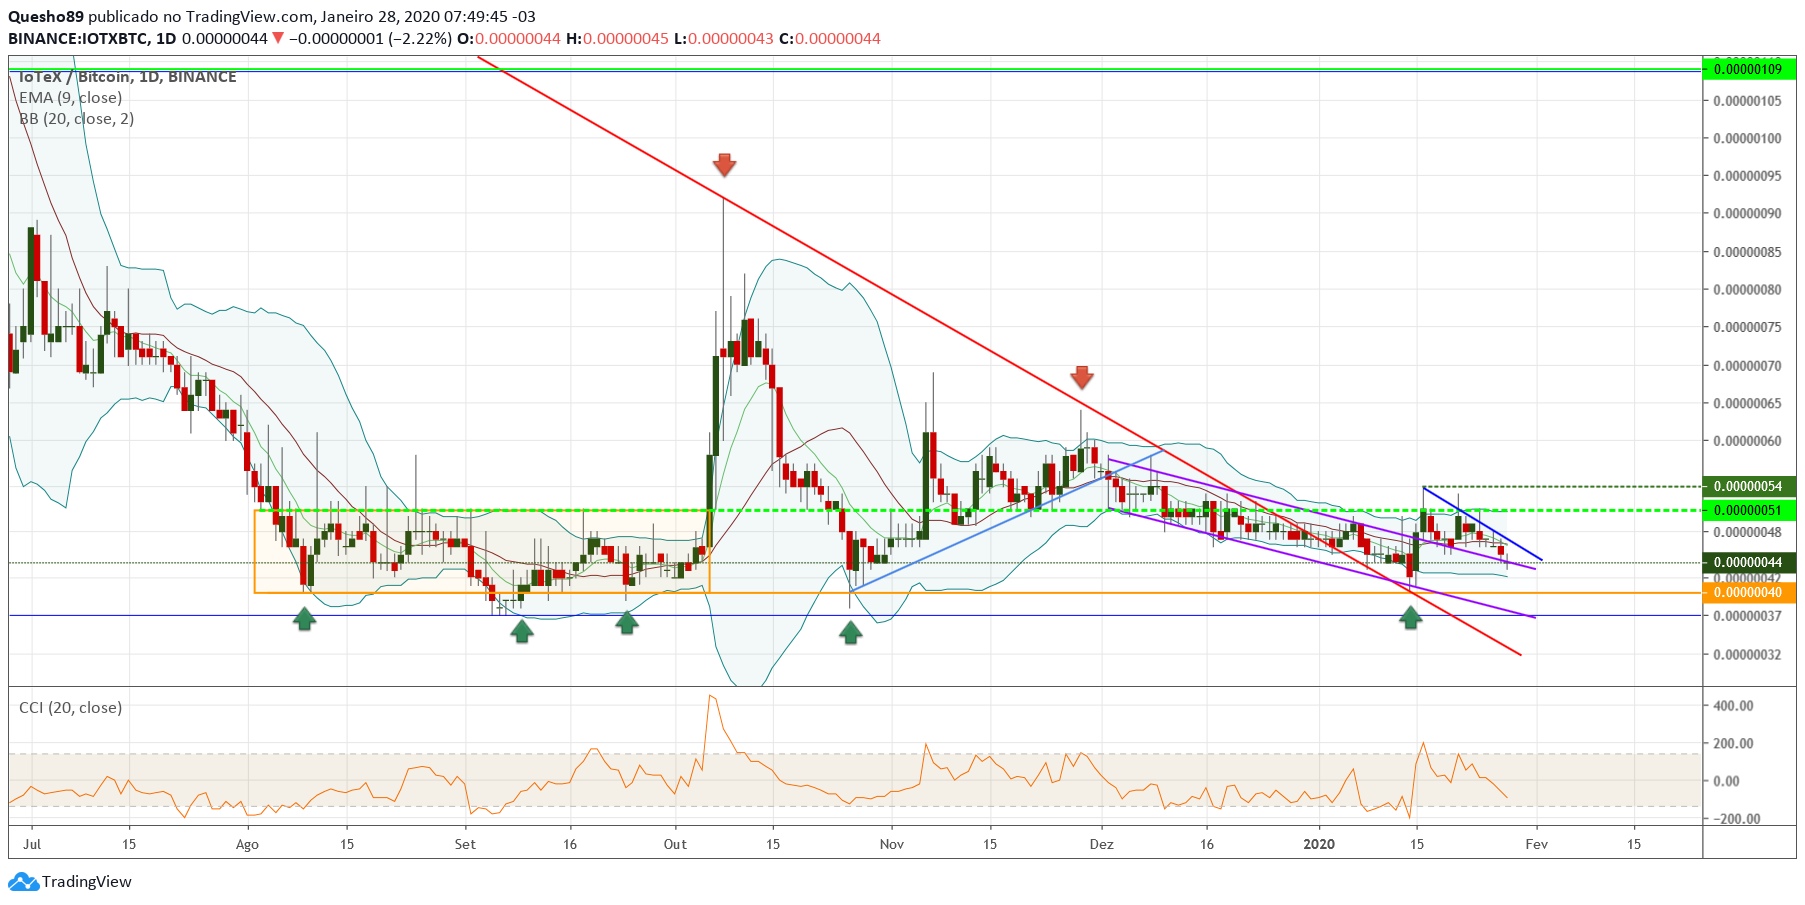
There’s a seven-month downtrend line (in red) which provides us lower highs since May (those highs are indicated by the red arrows)
There’s also a strong support zone at the 40 satoshis region (where the price has already touched 4 times as you can see in the green arrows). I would call this zone as “consolidation cluster” (orange rectangle) since the price didn’t see any movement except for the spike in early October.
It looks like the upper band of this consolidation cluster is now serving as support (at the 50 satoshis) as the price keeps flattening towards the downtrend line which gives us only two alternatives: dropping a little bit into the consolidation cluster again (and even driving us below it) or breaking out the downtrend line aiming to achieve higher highs.
In case of a breakout happens I see 67 satoshis as an immediate level to touch since it was both a previous support in May and a previous resistance last month. If the buyers really enter the game, the 89-sats level could also be touched since it was also a previous resistance in both July and October.
What about you? Do you feel we’re supposed to see a shift in the current levels? Let us know your opinions!
I prefer to follow IOTXUSD. IMHO, on short term there is one last and hard leg down on BTC to the 5 thousands, and that will pull the entire market down. Perhaps doble bottom on IOTEX at 0.0030 USD, perhaps some place between 0.0024 and 0.0030. After that price recovery is very possible.
Gotcha. In fact you’re bearish for BTC and this eventual leg down could potentially affect all alts. Interesting point of view. Let’s keep an eye on this for the next weeks.
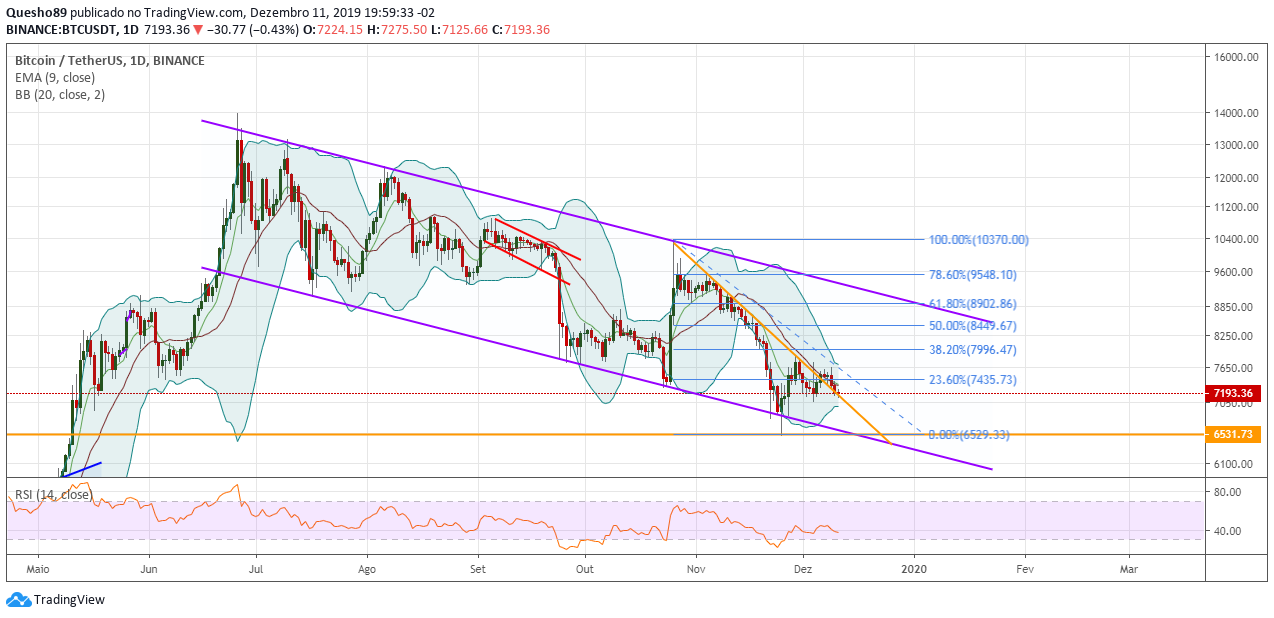
Wow 5k is an impressive level but I think the opposite since it looks like we could touch 8000-8400 first (because dropping down the channel is unlikely to me right now).
We’ve just surpassed that orange downtrend line which gives me a impression that we can have some fuel to go upwards in the next days/weeks (following a Fibo correction from the 10370 peak).
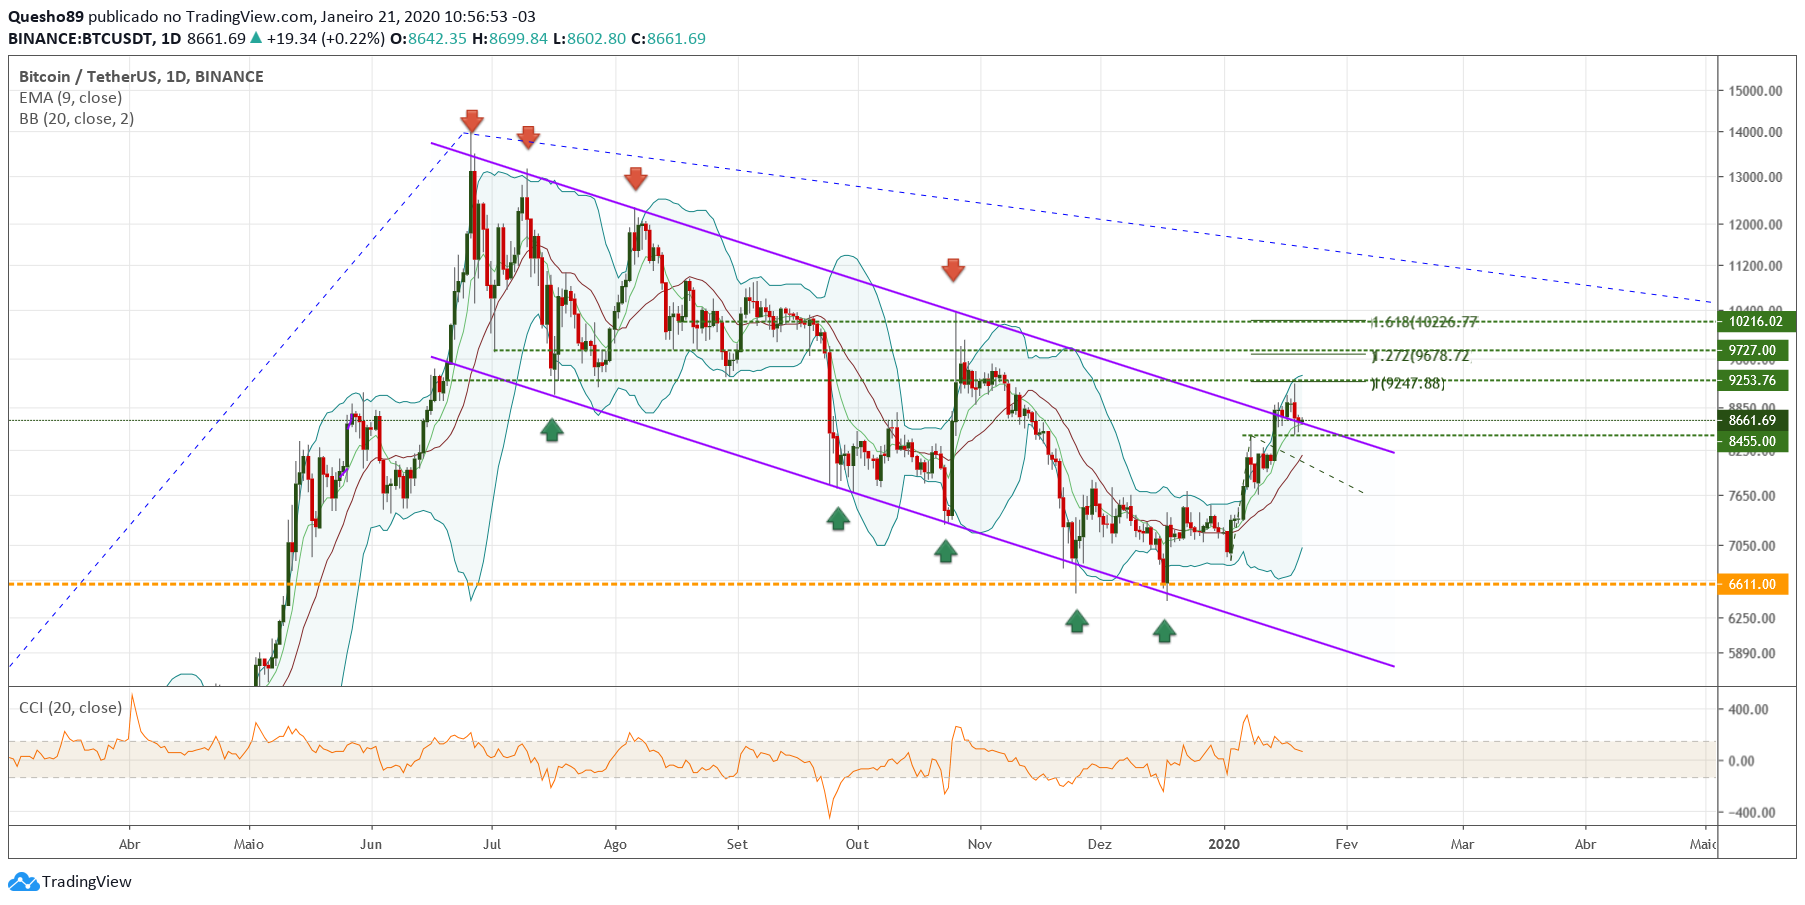
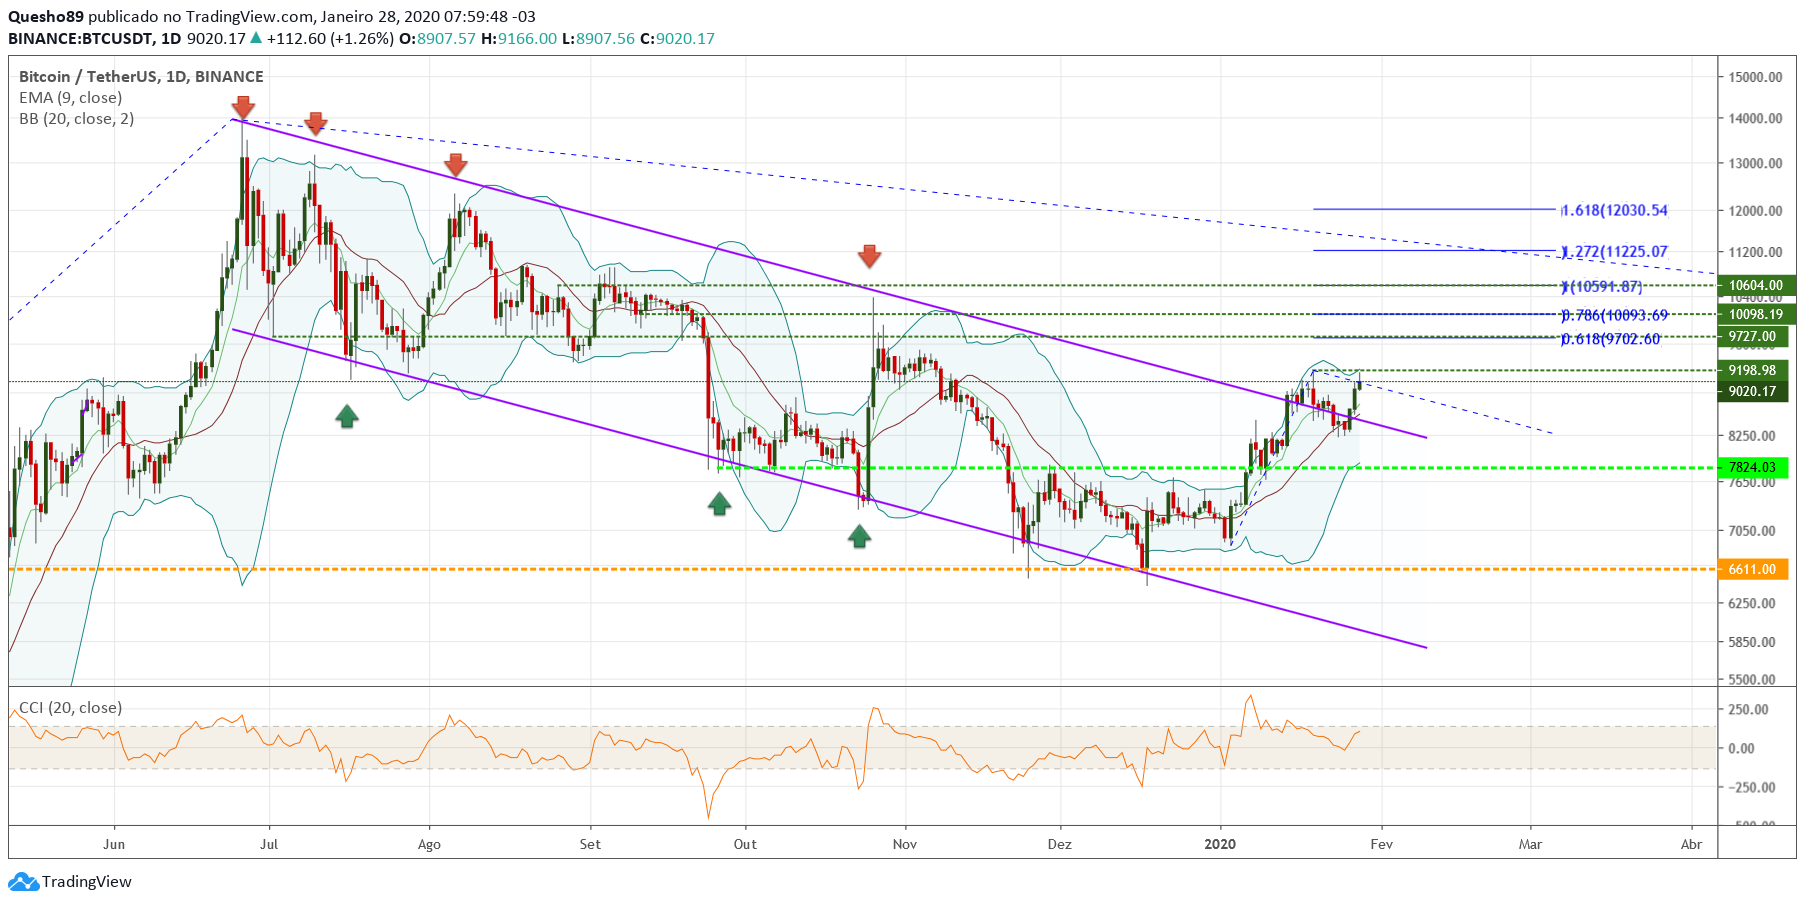
Wow. Lots of movements since last month and BTC is clearly attempting to get away from the channel we’ve studied. In fact 61,8% Fibonacci level wasn’t enough to stop BTC’s rally and we saw a rejection at 9200s. +20% since the last picture.
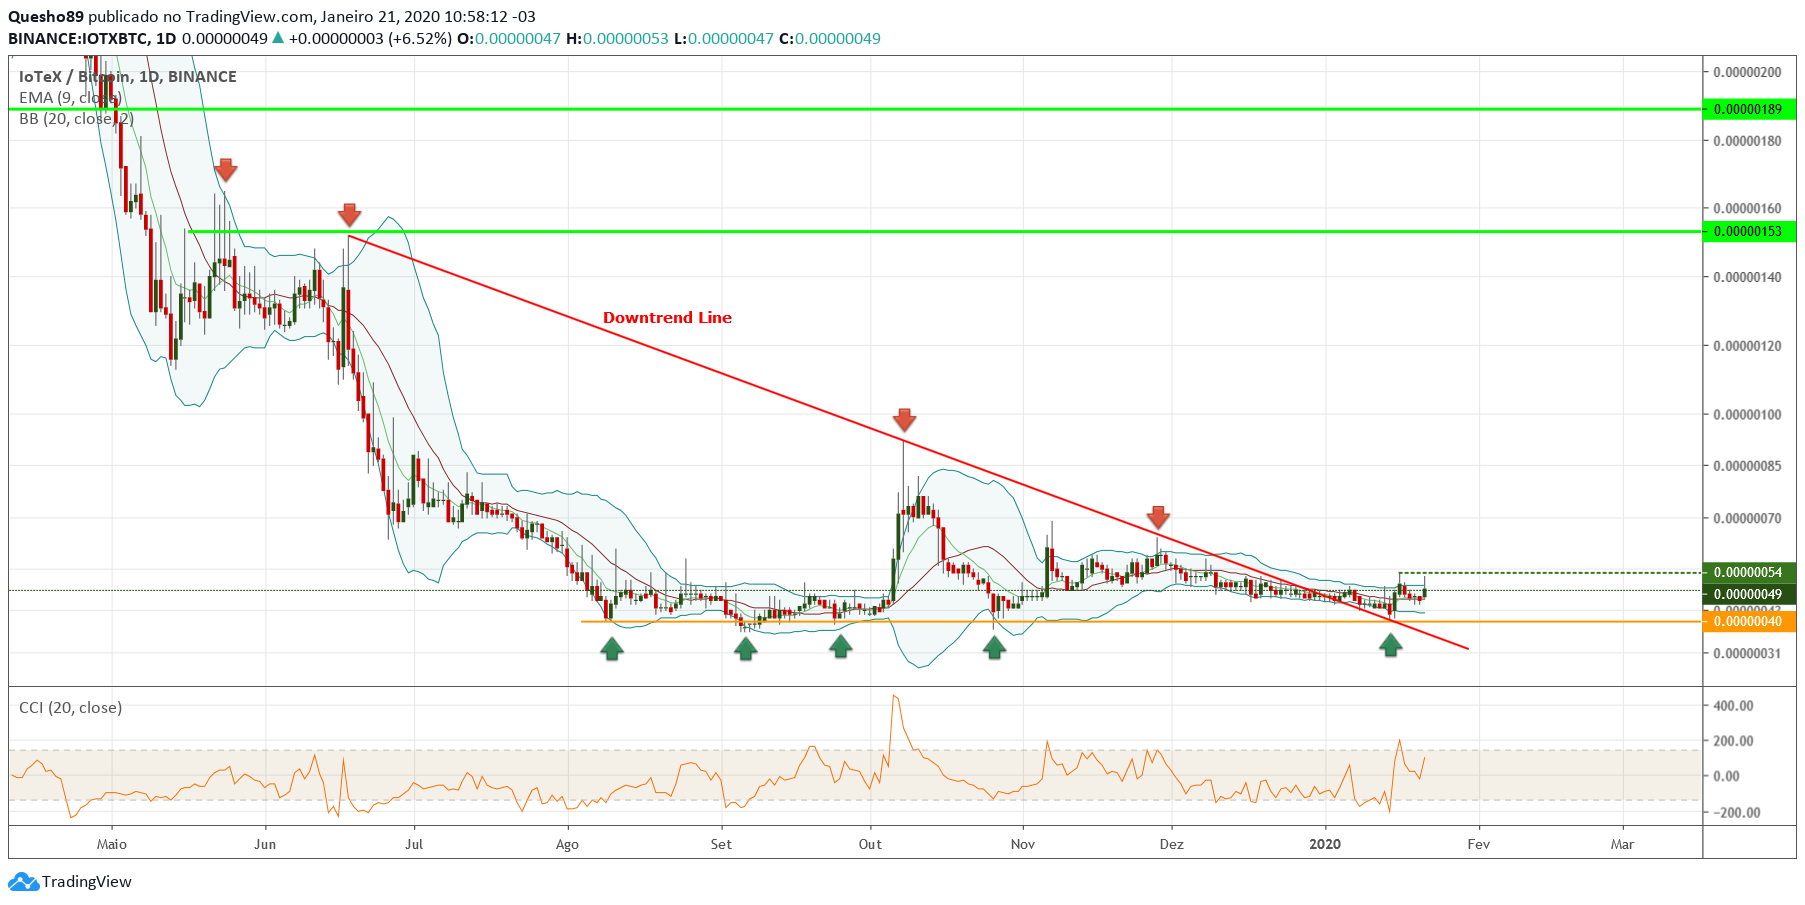
IOTX has been trading at sub 50s since last month which is kind of positive since we’ve found a strong support at 40sats. By the way it was retested as soon as we broke the red downtrend line. This means a candle closing above 54 sats could ignite a new wave up in the short term:
Hey IoTraders, here’s a weekly update for BTC and IOTX charts. Things getting bullish for BTC and messy for some alts… let’s take a look on the market right now:
BTC is ready to trigger a pivot point as soon as it gets a candle closing above $9,200 region. This would certainly ignite a potential new wave up. A rejection in this region would drive the price down and search for a touch in the nearest EMAs. Purple channel upper border acts like a resistance (downtrend line) in the weekly chart and that’s exactly where we’ve been seeing some consolidation for now.
As for IOTX-BTC, I’d like to present you three technical reasons why I’m bullish for the next weeks:
“The more a support region is tested, the stronger it becomes”. As we can see, we already had five attempts to break it. ALL OF THEM FAILED so yeah, we’ve got a pretty nice support zone around 40 sats which means buyers have been protecting it as their own souls - sellers will eventually give up trying to drive the price even lower.
There’s clearly a consolidation box (orange strucuture) between 40 and 51 sats and there was a spike every time prices got away from this region (note both Oct 6th and Nov 6th). Well, we’ve been under the region between 51 and 54 sats for the last few days so a generous upward movement would be expected as soon as we have a candle closing above it.
A ~40-day bearish channel (purple structure) was left behind as price reacted very well on Jan 15th. Now it would be time to consolidate above it in order to get some fuel and break upon the immediate resistances (green dashed lines).
NOTE: All of this obviously depends on how BTC will perform in the next weeks. A general bleeding in alts is a possible scenario if BTC goes further the $9,000 level and remains there but we should keep in mind that IOTX has been holding well during the last spikes, even though its volume has not been so strong (at least on Binance).
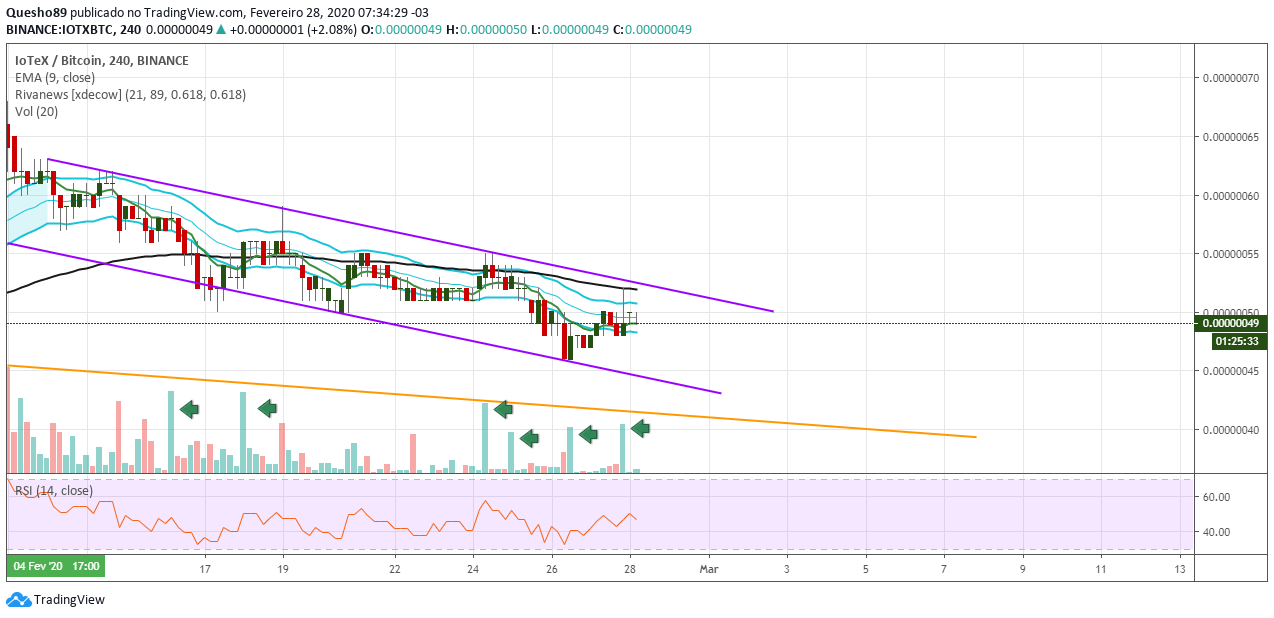
And… here we go. BTC all way up to over $10400 and down again with IOTX giving an interesting buy signal. We’re clearly on a downtrend channel but we’ve been getting extremely high volumes on some candles in the last few days.
Take the image above for example. Highlighted spikes show us that around 240,000,000 IOTX have been traded only in the last two weeks which is a HUGE amount according to the average for the same period. What does that mean? Well, someone is REALLY accumulating right now and I want to be on the buyers side when all of this spikes up. Could we go even lower? Who knows, although it looks like sell pressure has been getting weaker and we have an incredibly strong support at the 40’s. I just wanted you to know there are investors who believe this is the moment to buy.
Over a month has passed and we’re back with another quick review on IOTX-BTC price action.
While BTC has been ranging around 6600-7100 dollars, I would like to share a pretty good insight about the weekly chart for IoTeX. In fact, we have a bullish pattern to stick to.
YES. For some of you who might not be used to see something like that, its name is Bullish Divergence aka “Bull Div”. We have a bullish divergence when the price makes lower bottoms on the chart, while our indicator (RSI in this case) is giving us higher bottoms. We can clearly see that due to the inclination of the bue lines. Keep in mind we are likely to see a rapid price increase after a bullish divergence pattern.
Well, that’s not from me. You can learn a little bit more about divergences here.
Of course this is not a pattern that usually pans out quickly so we should wait for a while in order to get it confirmed. However, its formation keeps happening.
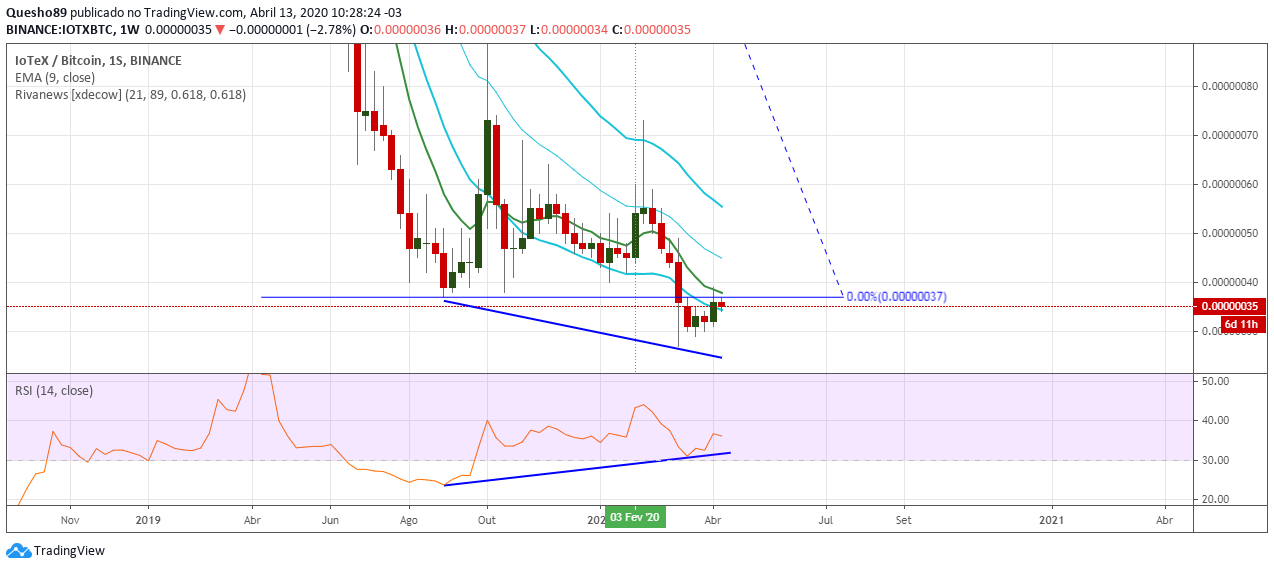
Here we go guys. BTC managed to go above 9000$ again while IOTX has been trading around 30 sats. I decided to go a little deeper into my previous pattern and I hope you enjoy my thoughts. Let’s take a look on the Binance weekly chart again:
What positive aspects can we see right here? As follows:
What I called a Bullish Divergence in the last post proved to be a “bullish falling wedge” as well. Figures like that are formed at a bottom of a downtrend and show both lower highs (red arrows) and lower lows (green arrows). Price projection is highlighted by the purple vertical box - assuming price would break out of the pattern until the end of June which is reasonable due to all of the exciting news we’ll get in the next few weeks.
Volume has been drying up along with the price. That’s another sign telling us the downtrend could come to an end soon. We could think of a bearish movement if there was any kind of divergence between price and volume but both of them are heading towards the same direction over the past weeks. Please see the ‘General Rules in Volume Analysis’ presented in this article for further information.
NOTES: Take-profit regions are shown in orange as we might think of 58 sats as TP1, 74 sats as TP2 and 92 sats as TP3. We should also mention 109 sats - which is 23% Fibo Retracement from the peak reached on April 2019 - and 120 sats which is the projection for an optimistic falling wedge breakout like I explained above.
Don’t get fooled by whale movements at this time. Play smart and think of the mid-to-long term.